Reorder point formula: how do you know when to reorder stock?
By Andrew Simpson, founder of Canopy Inventory. Last updated .
Quick answer
Reorder point = average daily sales x lead time in days + safety stock. When stock of a SKU falls to that number, place the order. Example: selling 4 units a day, with a 30-day lead time and 40 units of safety stock, the reorder point is 4 x 30 + 40 = 160 units. The same rule works as a date: reorder by the day stock is expected to run out, minus your lead time and safety stock days.
What is a reorder point?
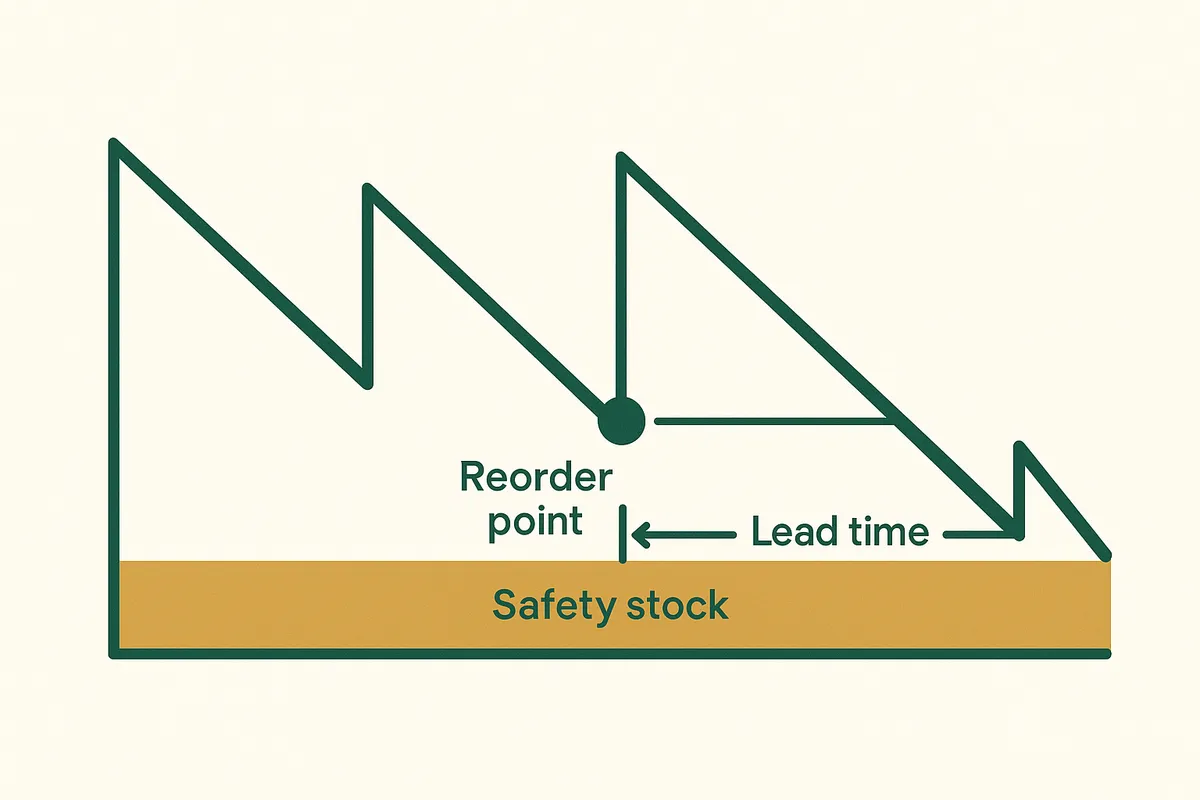
A reorder point (also called a reorder level or ROP) is the stock level that tells you to place the next order. It is set so that the order arrives before you run out: the stock you hold at that moment has to last through the whole lead time, with a buffer of safety stock left over for a late delivery or a busy week.
It is worked out per variant SKU, in units. "Navy, size M" and "Navy, size XL" sell at different rates, so they need different reorder points. For how long your stock lasts overall, see weeks of cover.
The reorder point formula
Reorder point = (average daily sales x lead time in days) + safety stock
Lead time demand = average daily sales x lead time in days
Average daily sales is units sold in a recent window divided by the days in it. Lead time is the days from placing an order to the stock being ready to sell. Lead time demand is what you expect to sell while you wait. Safety stock is extra stock held for when demand is higher or the delivery is later than planned. With no safety stock, the reorder point is simply lead time demand.
Worked example
Example (made-up round numbers)
Your supplier takes 30 days from order to stock on the shelf.
Lead time demand = 4 x 30 = 120 units.
You hold 40 units of safety stock.
Reorder point = 120 + 40 = 160 units.
When available stock falls to 160, place the order. If it all goes to plan, you sell 120 units while you wait and the delivery lands with 40 units still in stock.
Reorder point in units vs in days
Safety stock is often easier to think about in days of sales than in units: "two weeks of extra stock" rather than "56 units". Convert with the daily sales rate. In days, the reorder point is simply the lead time plus the safety stock days, and you can turn it into a date.
Safety stock (units) = safety stock days x average daily sales
Reorder point (days of cover) = lead time days + safety stock days
Reorder-by date = stockout date - (lead time days + safety stock days)
Example (made-up round numbers)
In days, the reorder point is 30 + 10 = 40 days of cover.
You have 400 units today, so stock runs out in 400 / 4 = 100 days.
Reorder-by date = 100 - (30 + 10) = 60 days from today.
Check: after 60 days you have sold 240 units and have 160 left, which is the reorder point in units. Both versions give the same answer.
The date version is the one to plan with. A reorder point in units tells you to act once stock has already fallen; a reorder-by date tells you weeks ahead, so you can group SKUs from the same supplier into one order. Try both with the weeks of cover calculator, or work out a reorder point with statistical safety stock in the reorder point calculator.
How do I know when to reorder stock?
Reorder when a SKU reaches its reorder point, or on its reorder-by date, whichever way you track it. Ordering on gut feel goes wrong in two directions: too late, and a best seller is out of stock for the length of the lead time while you wait; too early, and cash sits in stock you did not need yet. The longer the lead time, the longer it takes to see the mistake.
A simple routine:
- Once a week, list every variant SKU with its available stock and its average daily sales.
- Work out each reorder point, or each reorder-by date, from the lead time and safety stock for that supplier.
- Order every SKU at or below its reorder point, or whose reorder-by date is this week or has passed.
- Group those SKUs by supplier, so each supplier gets one order.
- Recalculate as sales change. A reorder point set months ago uses an old sales rate.
When the formula needs adjusting
- Seasonal products: a rolling average lags behind a seasonal rise. Look at the same weeks last year as well; see seasonal weeks of cover adjustments.
- New products: with little sales history, the rate is a guess. Check it weekly and order cautiously until the rate settles.
- Bundle components: a product sold on its own and inside bundles runs down faster than its own sales suggest. Count units sold inside bundles towards each component.
- Stockouts in the window: days when the SKU could not sell pull the average down. Pick a window that avoids them.
How to calculate average daily sales
Divide units sold in a recent window by the days in it: 120 units in 30 days is 4 a day. 30 days suits most steady sellers; slow sellers need 60 or 90 days to show a rate at all, and a product that is taking off may need 7 or 14. Use net units (after cancellations and refunds), and leave out a window that includes a big promotion.
How much safety stock to add
Two common approaches: a fixed number of days of sales (simple, and easy to explain to a supplier), or the statistical formula, which sizes the buffer from how much daily sales vary and the service level you want. The safety stock formula guide covers both. More safety stock means fewer stockouts and more cash tied up, so it is a trade-off you set per product.
Reorder point vs reorder quantity
The reorder point says when to order. The reorder quantity says how much. One way to size it is to order enough to last through the lead time, then a target number of days, plus safety stock, minus what you already have and have on order:
Buy quantity = (lead time + target cover + safety stock days) x daily sales - (stock + units on order), rounded up to the pack size, then raised to the minimum order quantity (MOQ) if lower
Inventory replenishment: putting reorder points to work
Inventory replenishment is the cycle of reordering and restocking so each product stays in stock without piling up. Reorder points decide when, the buy quantity decides how much, and lead time decides how far ahead you have to look. Start with your best sellers, where a stockout costs the most, then work down the list.
How to work out reorder points from Shopify reports
You can get every input from your Shopify admin and finish the sums in a spreadsheet:
- Get stock per variant. Use the Available quantity, not On hand: On hand includes units already committed to unfulfilled orders.
- Get average daily sales. In Analytics > Reports, the "Inventory sold daily by product" report shows the average number of items sold per day for each product variant over the period you choose.
- Get lead times. If you raise purchase orders in Shopify (Products > Purchase orders), compare the date you placed each order with the date you received it. See how to calculate lead time.
- In a spreadsheet, add reorder point = daily sales x lead time days + safety stock for each variant.
- Add a column for available minus reorder point, and sort it smallest first. At or below 0 means order now.
This works, but it is a snapshot: it goes out of date with every sale and every delivery, so it has to be rebuilt each week.
How Canopy Inventory does it
Canopy Inventory, a read-only Shopify app coming soon to the Shopify App Store, expresses the reorder point as a date. For every SKU it works out a stockout date from your Shopify sales rate, then a reorder-by date: the stockout date minus your lead time and safety stock days. When a buy is due and that date is today or has passed, or the SKU is out of stock, the table says "Order now" and shows the date it was due. It also suggests a buy quantity using the formula above.
Lead time, safety stock (in days), target cover, pack size and minimum order are settings: shop-wide on the Free plan, which covers your 50 most recently sold SKUs, and per supplier and per SKU on Growth. The full rules, including what the app does not adjust for, are on how Canopy Inventory calculates.
See a reorder-by date for every SKU
Canopy Inventory shows how many weeks of stock each SKU has left, when it runs out and what to reorder. Read-only. Free for your 50 most recently sold SKUs.
Sources
- Shopify Help Center, Inventory reports ("Inventory sold daily by product"). Checked 6th November 2026.
- Shopify Help Center, Inventory states (available, on hand and committed). Checked 6th November 2026.
- Shopify Help Center, Creating purchase orders. Checked 6th November 2026.
- Canopy Inventory's own rules: how Canopy Inventory calculates.
Frequently Asked Questions
Reorder point = average daily sales x lead time in days + safety stock. Selling 4 a day with a 30-day lead time and 40 units of safety stock gives 4 x 30 + 40 = 160 units.
Reorder when a SKU's available stock falls to its reorder point, or on its reorder-by date: the day stock is expected to run out, minus your lead time and safety stock days. Check every variant at least weekly, because the sales rate changes.
Earlier than it feels. The stock you hold when you order has to last the whole lead time plus your safety stock. With a 90-day lead time, a SKU with 12 weeks of cover is already late.
Take average units sold per day for the variant (Shopify's "Inventory sold daily by product" report), multiply by your supplier lead time in days, and add your safety stock in units. Compare it with the variant's Available quantity.
Yes. Reorder level, reorder point and ROP all mean the stock level at which you place the next order.
Safety stock is the buffer you hope never to use. The reorder point is the trigger to order, and it includes the safety stock: lead time demand plus safety stock.
Yes. Each variant sells at its own rate, so a single reorder point for the whole product overstocks the slow sizes and runs the fast ones out.
Related pages
Stockout date, reorder-by date and buy quantity for one SKU.
A reorder point with statistical safety stock.
How long your stock lasts at your current sales rate.
The reorder-by date and buy quantity rules, written out.
Related Articles

Lead Time: Meaning, How to Calculate It and How It Sets Your Reorder Date
Lead time is the time from ordering to stock ready to sell. What it includes, how to calculate it from your purchase orders, and how it sets your reorder date.
Safety Stock Formula: Days, Units and Statistical Methods
Four ways to calculate safety stock: days, fixed units, max minus average and the statistical formula, with one worked example and Shopify steps.

Christmas Stock Planning: Seasonal Weeks of Cover
A by-hand method for Christmas stock planning: work out a seasonal factor from last year, adjust weeks of cover for the peak and find your order date.
Get the Canopy Inventory install link
Canopy Inventory is coming soon to the Shopify App Store. One email the day it's live. Free for your 50 most recently sold SKUs.