Safety Stock Formula: How to Calculate the Buffer That Prevents Stockouts
By Canopy Team
Quick answer
Safety stock is the extra inventory you hold above your expected demand to protect against variability in both demand and supply. The standard formula is: Safety Stock = Z x σd x √LT — where Z is your service level factor (1.65 for 95% in-stock rate), σd is the standard deviation of daily demand, and √LT is the square root of your lead time in days. For a product selling 15 units per week with variable demand and a 27-week lead time (like Bailey & Coco's China imports), the safety stock calculation is significantly different from a product with a 3-day lead time from a UK supplier. Getting this formula right prevents stockouts without tying up excessive cash in buffer inventory.
What safety stock actually is (and why you need it)
Safety stock is not "extra stock just in case." It's a mathematically calculated buffer based on how unpredictable your demand and supply are.
Consider two scenarios:
Scenario A: You sell exactly 100 units per week, every week, and your supplier delivers in exactly 14 days, every time. You need zero safety stock. You reorder 200 units when your stock hits 200, and it arrives precisely as you sell the last unit.
Scenario B (reality): You sell between 70 and 140 units per week depending on marketing campaigns, seasonal trends, and competitor activity. Your supplier sometimes delivers in 12 days, sometimes in 20 days, and once took 35 days because of a production delay. Without safety stock, you'd stock out every time demand spiked above average or your supplier delivered late.
Safety stock bridges the gap between the predictable world your purchasing system assumes and the chaotic reality of variable demand and unreliable supply chains.
The cost of not holding safety stock is stockouts — lost sales, disappointed customers, damaged search rankings (Shopify drops out-of-stock products from collections), and potential loss of wholesale accounts. The cost of holding too much safety stock is tied-up cash, storage costs, and the risk of obsolescence. The formula gives you the mathematically optimal balance.
The formula explained in plain English
The standard safety stock formula is:
Safety Stock = Z x σd x √LT
Let's break down each component:
Z (service level factor) This is a number from a statistical table that represents how confident you want to be about not stocking out. It's based on the normal distribution.
- Z = 1.28 → 90% service level (you'll be in stock 90% of the time) - Z = 1.65 → 95% service level (the standard target for most ecommerce) - Z = 2.05 → 98% service level - Z = 2.33 → 99% service level
Higher Z = more safety stock = less stockout risk but more cash tied up. For most Shopify brands, 95% (Z = 1.65) is the right target. Going from 95% to 99% roughly doubles your safety stock — that's a lot of extra cash for 4% improvement.
σd (sigma-d: standard deviation of demand) This measures how much your daily sales fluctuate around the average. If you sell exactly 10 units every day, σd = 0. If you sell anywhere from 2 to 25 units per day, σd is high.
To calculate it: take your daily sales for the last 90 days. Calculate the average. Then calculate the standard deviation (the STDEV function in Excel/Google Sheets does this).
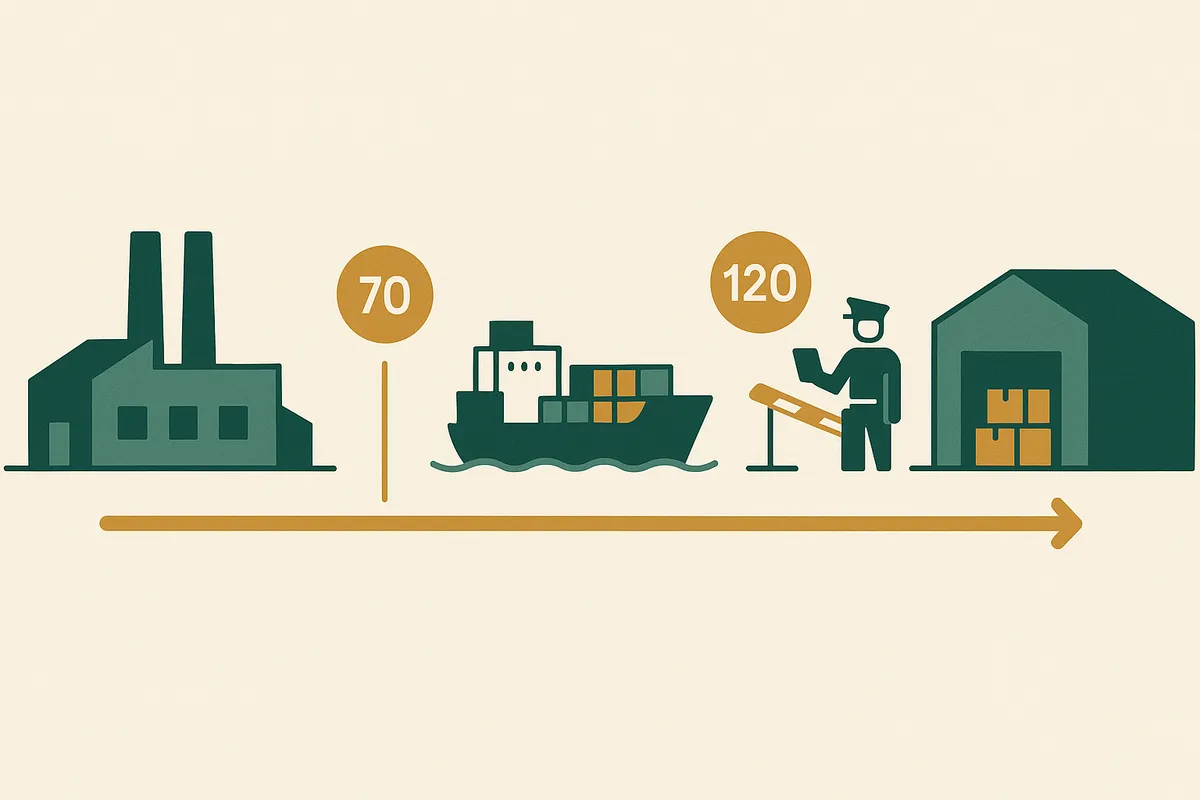
√LT (square root of lead time) Lead time in days, square-rooted. This is the multiplier that accounts for how long you're exposed to demand variability. Longer lead times mean more time for demand to deviate from expectations, so you need proportionally more safety stock.
For a UK supplier with 5-day lead time: √5 = 2.24 For China imports with 190-day lead time: √190 = 13.78
This is why China-sourced products need dramatically more safety stock than UK-sourced products — the square root of lead time multiplier is 6x larger.
Worked example: Bailey & Coco best-selling harness
Let's calculate the safety stock for Bailey & Coco's best-selling harness — the "Meadow" pattern in size Medium.
Given data: - Average daily sales: 2.14 units/day (15 per week) - Standard deviation of daily demand: 1.2 units/day (calculated from 90 days of sales data — some days they sell 0, peak days they sell 5-6) - Lead time: 190 days (China production + sea freight + customs) - Target service level: 95% (Z = 1.65)
Calculation: Safety Stock = Z x σd x √LT Safety Stock = 1.65 x 1.2 x √190 Safety Stock = 1.65 x 1.2 x 13.78 Safety Stock = 27.3 units
Round up to 28 units.
So Bailey & Coco should hold 28 units of the Meadow Medium harness as safety stock — on top of their expected demand during the lead time period.
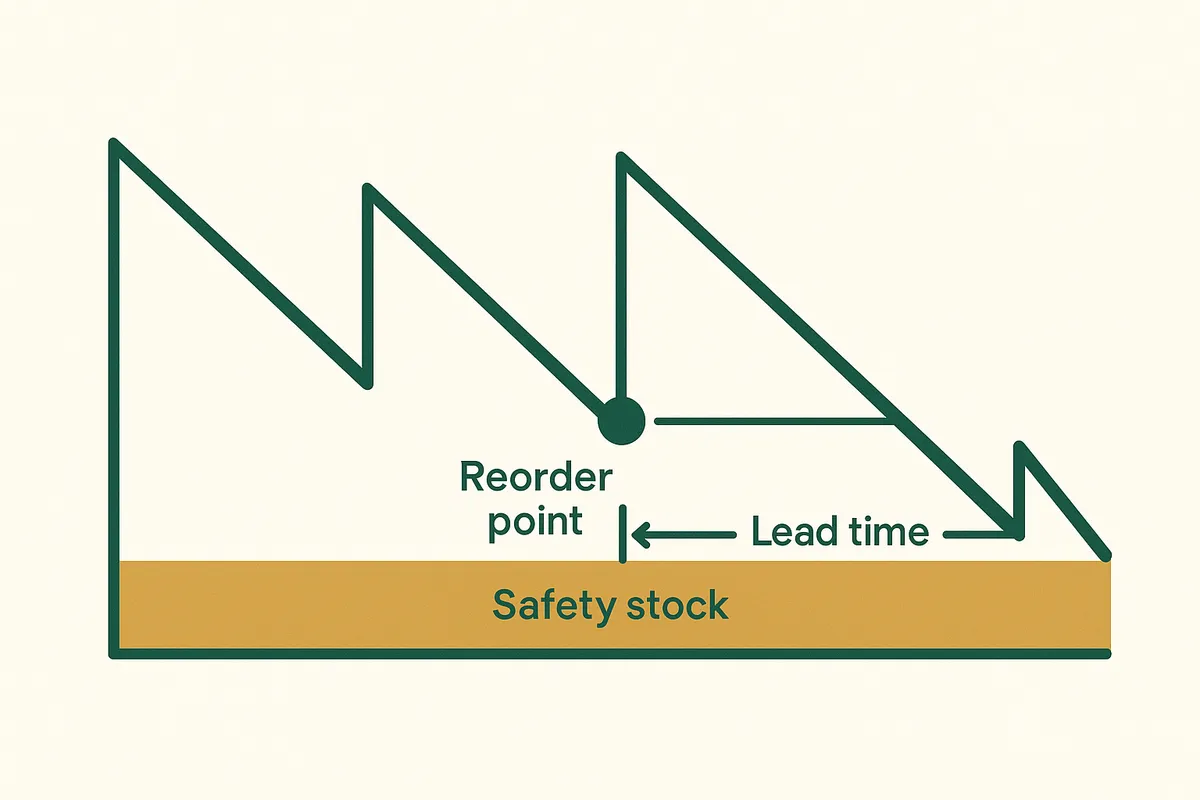
What this means in practice: Expected demand during 190-day lead time: 2.14 x 190 = 407 units Safety stock: 28 units Reorder point: 407 + 28 = 435 units
When their stock of Meadow Medium drops to 435 units, they should place a new purchase order. The 28-unit buffer gives them 95% confidence of not stocking out before the new shipment arrives.
The cost of this safety stock: At a landed cost of £7.65 per unit (from the landed cost calculation), 28 units of safety stock ties up £214 of cash in this single SKU. Across their top 50 SKUs, that's roughly £10,000-12,000 in safety stock holding. That's the insurance premium against stockouts.
Calculate your reorder points automatically
Canopy gives Shopify brands the inventory clarity they need to grow.
How demand variability changes the calculation
The standard deviation of demand (σd) is the most impactful variable you can control. Products with stable, predictable demand need less safety stock. Products with wildly fluctuating demand need much more.
Compare two of Bailey & Coco's products:
Product A: Classic Black collar (evergreen, stable demand) - Average daily sales: 3.0 units - Standard deviation: 0.8 units (consistent daily sales) - Safety stock at 95%: 1.65 x 0.8 x 13.78 = 18 units
Product B: Christmas Tartan bandana (seasonal, spiky demand) - Average daily sales: 2.0 units (when averaged across the year) - Standard deviation: 4.5 units (sells 0 per day in summer, 15-20 per day in November-December) - Safety stock at 95%: 1.65 x 4.5 x 13.78 = 102 units
The Christmas bandana has lower average demand but needs 5.7x more safety stock because its demand is so unpredictable. This is counterintuitive — most merchants would hold more safety stock for the faster-selling item.
Important caveat: for highly seasonal products, the standard formula breaks down because the normal distribution assumption doesn't hold. A product that sells 0 units for 9 months and 20 units/day for 3 months isn't normally distributed. For these products, calculate safety stock based only on the in-season demand period, and plan your purchasing around the season start date rather than using a continuous reorder point.

Factoring in lead time variability
The basic formula assumes lead time is fixed. In reality, your supplier doesn't always deliver in exactly 190 days. If lead time itself varies, you need an extended formula:
Safety Stock = Z x √(LT x σd² + d² x σLT²)
Where: - σLT = standard deviation of lead time (in days) - d = average daily demand
For Bailey & Coco's harness: - Average lead time: 190 days - Standard deviation of lead time: 15 days (based on tracking actual arrival dates over 8 shipments) - Average daily demand: 2.14 units - Standard deviation of daily demand: 1.2 units
Extended formula: Safety Stock = 1.65 x √(190 x 1.2² + 2.14² x 15²) Safety Stock = 1.65 x √(190 x 1.44 + 4.58 x 225) Safety Stock = 1.65 x √(273.6 + 1,030.5) Safety Stock = 1.65 x √1,304.1 Safety Stock = 1.65 x 36.1 Safety Stock = 59.6 → round to 60 units
Notice the jump from 28 units (basic formula) to 60 units (extended formula). Lead time variability more than doubled the required safety stock. This is why tracking your actual lead times — not your supplier's quoted lead times — is critical for accurate safety stock calculations.
The 15-day standard deviation in lead time is real for Bailey & Coco. Production delays, port congestion, and customs inspections create genuine variability. Ignoring this means your safety stock is systematically undersized.
Service level targets: choosing the right Z value
Your service level target should not be the same for every product. Setting everything at 95% is a common default, but a smarter approach is tiered service levels based on product importance.
Tier 1: Hero products (top 10% by revenue) → 98% service level (Z = 2.05) These are the products customers come to your site for. A stockout on your hero SKU loses sales and damages brand reputation. Bailey & Coco's top 10 collar patterns get 98% service level.
Tier 2: Core range (middle 60% by revenue) → 95% service level (Z = 1.65) The standard target. These products should be in stock most of the time, but an occasional stockout isn't catastrophic.
Tier 3: Long tail (bottom 30% by revenue) → 90% service level (Z = 1.28) These products contribute relatively little revenue. Holding extensive safety stock for them ties up cash that would be better deployed on Tier 1 and 2 products.
The financial impact of this tiering is significant. Moving your entire range from 95% to a tiered approach (98/95/90) typically reduces total safety stock investment by 15-20% while actually improving availability on the products that matter most.
The maths: going from Z = 1.65 to Z = 2.05 increases safety stock by 24% per SKU. But you only apply this to 10% of SKUs. Meanwhile, dropping from Z = 1.65 to Z = 1.28 for 30% of SKUs saves 22% on those lines. Net result: better protection where it matters, less cash tied up overall.

Common safety stock mistakes
After reviewing safety stock calculations for dozens of ecommerce brands, the same mistakes keep appearing.
Mistake 1: Using averages instead of standard deviation. Some merchants calculate safety stock as "2 weeks extra supply" regardless of demand variability. This over-protects stable products and under-protects variable ones. Use the actual standard deviation of demand.
Mistake 2: Ignoring lead time variability. The basic formula assumes fixed lead time. If your supplier's delivery window varies by more than 10%, use the extended formula that accounts for lead time standard deviation. For China imports, this variance is almost always significant.
Mistake 3: Calculating on weekly data instead of daily. Using weekly sales data smooths out the daily variability that causes stockouts. Calculate σd from daily data for accurate results. If a product sells 7/week but all 7 sell on Saturday, the daily variability is very different from 1/day evenly.
Mistake 4: Not recalculating regularly. Demand patterns change — seasonality, marketing campaigns, competitor activity, and trend shifts all affect σd. Recalculate safety stock quarterly at minimum, monthly for fast-changing categories.
Mistake 5: Applying the formula blindly to seasonal products. The formula assumes normally distributed demand. Products with extreme seasonality need a different approach — calculate based on in-season demand only and use seasonal purchasing calendars instead of continuous reorder points.
Implementing safety stock in your inventory system
Calculating safety stock once is useful. Having it automatically integrated into your reorder points and purchasing decisions is transformative.
Here's how to operationalise the formula:
1. Build a SKU-level spreadsheet — for each active SKU, record average daily demand, standard deviation of demand, lead time, lead time variability, and target service level. Calculate safety stock and reorder point per SKU.
2. Set reorder points in your inventory system — your reorder point for each SKU is: (Average Daily Demand x Lead Time) + Safety Stock. When available stock crosses this threshold, it's time to order.
3. Review weekly — check which SKUs have breached their reorder point. Generate purchase orders for these items.
4. Recalculate monthly — update the demand statistics (average and standard deviation) monthly to keep safety stock aligned with current demand patterns.
For brands managing 500+ SKUs, doing this manually in spreadsheets becomes a full-time job. Canopy automates the entire calculation — it pulls real-time sales data from Shopify, calculates demand variability per SKU, applies your service level targets, and tells you exactly when and how much to reorder with safety stock built into every recommendation.
Automate your safety stock calculations
Canopy gives Shopify brands the inventory clarity they need to grow.
Frequently Asked Questions
The standard safety stock formula is: Safety Stock = Z x σd x √LT. Z is the service level factor (1.65 for 95% target), σd is the standard deviation of daily demand, and √LT is the square root of lead time in days. For situations where lead time also varies, use the extended formula: Safety Stock = Z x √(LT x σd² + d² x σLT²).
It depends on demand variability and lead time. A product selling 15 units per week with a 5-day UK lead time might need 5-8 units of safety stock. The same product with a 190-day China import lead time might need 28-60 units. Calculate using the formula with your actual demand standard deviation and lead time rather than using a flat percentage or weeks-of-supply rule.
Use tiered service levels: 98% (Z = 2.05) for your top 10% revenue products, 95% (Z = 1.65) for your core range (middle 60%), and 90% (Z = 1.28) for long-tail products (bottom 30%). This approach reduces total safety stock investment by 15-20% while improving availability on the products that matter most.
Monthly at minimum for fast-changing categories. Quarterly for stable product lines. Always recalculate after significant demand shifts such as a viral social media post, new wholesale account, seasonal transition, or marketing campaign that changes the demand pattern for specific SKUs.
The standard formula assumes normally distributed demand, which breaks down for highly seasonal products. For seasonal items, calculate safety stock using only in-season demand data (average and standard deviation from the selling period, not the full year). Use seasonal purchasing calendars aligned with lead times rather than continuous reorder points.
Reorder point = (Average Daily Demand x Lead Time) + Safety Stock. The first part covers expected demand during the replenishment window. Safety stock is the additional buffer for demand variability and supply uncertainty. When your available stock drops to the reorder point level, place a new purchase order.
Related pages
Related Articles
Weeks Cover in Stock Management: Formula, Examples & How to Use It
Weeks cover tells you how many weeks your current stock will last at the current sales rate. Learn the formula, what good weeks cover looks like, and how to calculate it for thousands of SKUs.
Importing from China: The Stock Management Guide for UK Ecommerce Brands
The 190-day lead time problem is real. Learn how to manage stock when you source from China — ordering calendars, MOQ strategy, Chinese New Year planning, and packing list verification with real examples from a brand managing 152 patterns.

Dead Stock in Ecommerce: How to Identify, Calculate Cost & Eliminate It
Dead stock costs the average Shopify merchant 20-30% of their inventory value. Learn how to identify dead stock, calculate the true carrying cost, and build clearance strategies that recover cash.
Get early access to Canopy
The inventory system built for Shopify brands. No spam — just a heads-up when we launch.