How to Adjust Weeks Cover Targets for Seasonal Demand
By Canopy Team
Quick answer
Static weeks cover targets are dangerous because ecommerce demand is not static. You should increase weeks cover targets 8-12 weeks before major sales peaks (Black Friday, Christmas) and decrease them during predictable lulls (January, summer). The formula: take your baseline weeks cover target and multiply by a seasonal index — typically 1.5-2.0x for peak periods and 0.6-0.8x for troughs. If your standard target is 8 weeks cover, a Christmas peak target would be 12-16 weeks, ordered far enough in advance to account for your full lead time.
The problem with fixed weeks cover targets
Most inventory guides tell you to set a weeks cover target — say, 8 weeks — and maintain it year-round. This advice is dangerously simplistic for any brand with seasonal demand variation. If you sell dog accessories, your November sales might be 3x your February sales because of Christmas gifting. If your weeks cover target stays at 8 weeks in both months, you will stockout in November (because 8 weeks of November-rate stock is far more units than 8 weeks of February-rate stock) and be massively overstocked in February (because 8 weeks of February stock lasts much longer when nobody is buying).
Seasonal weeks cover adjustment is the practice of varying your target based on anticipated demand changes. It sounds obvious once stated, but the majority of ecommerce brands we speak to are running fixed targets and wondering why they cycle between stockouts and overstock.
How to calculate seasonal indexes from your data
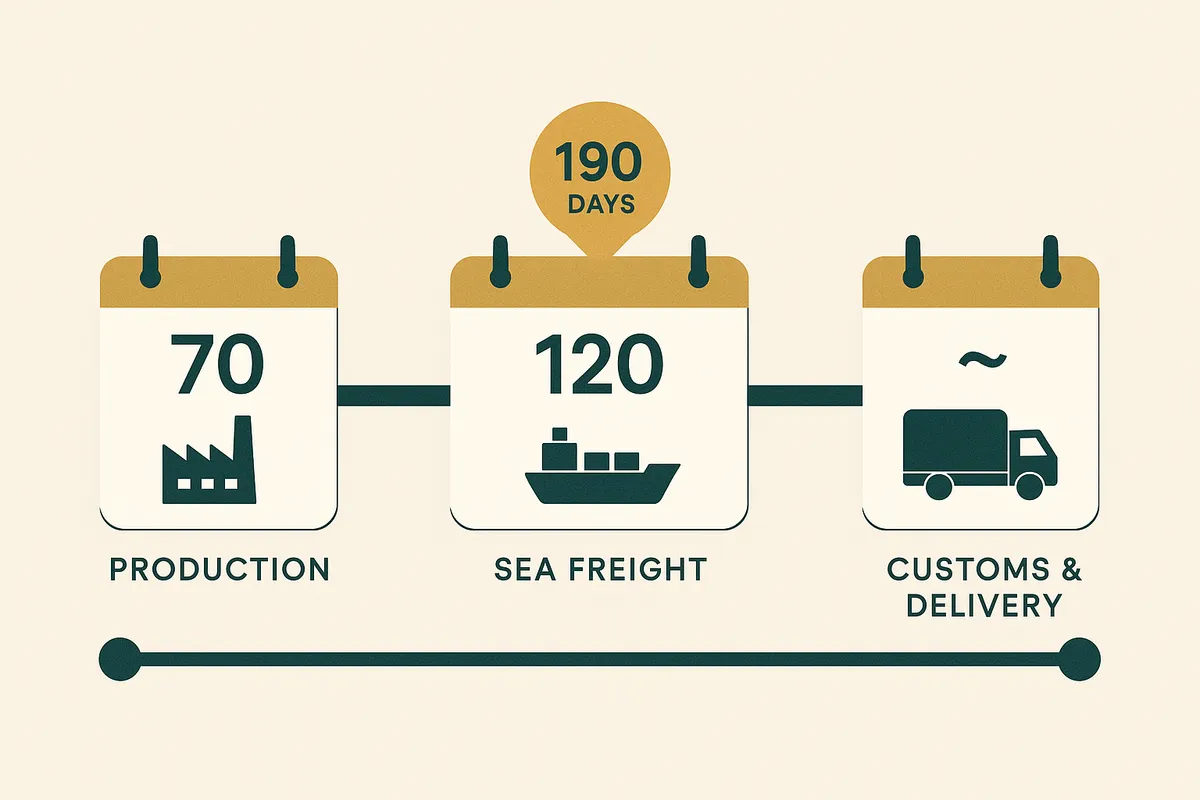
A seasonal index is simply the ratio of a period's sales to your average sales. Pull your monthly sales data for the last 2-3 years from Shopify analytics. Calculate the average monthly sales across all months. Then divide each month's actual sales by that average. If your average monthly revenue is £25,000 and November typically does £62,500, your November seasonal index is 2.5. If July typically does £15,000, your July index is 0.6. Now multiply your baseline weeks cover target by each month's index. With an 8-week baseline: November target = 8 x 2.5 = 20 weeks cover. July target = 8 x 0.6 = 4.8 weeks cover. The critical point: you need to order stock for November weeks cover targets far in advance. If your lead time is 190 days (like Bailey & Coco's China supply chain), you need to place your Christmas stock order in May.
Black Friday and Cyber Monday planning
Black Friday is the most compressed demand spike in ecommerce. Sales can be 5-10x a normal day, concentrated into a 96-hour window (Friday through Monday). Standard weeks cover calculations break down at this granularity because they are designed for weekly averages, not daily spikes.
The approach that works: treat BFCM as a separate demand event layered on top of your monthly seasonal planning. Estimate your BFCM unit sales for each SKU based on last year's data plus any planned promotional uplift. Add these units to your November weeks cover requirement. Then consider the recovery period — the 2-3 weeks after BFCM when sales drop below normal as customers have pre-bought. Many brands over-order for BFCM and end up with excess stock in December that they have to discount further.

How Bailey & Coco manages seasonal patterns
Bailey & Coco's seasonal pattern is more complex than a simple Christmas spike. As a dog accessories brand, they see four distinct seasons:
Spring (March-May): New puppy season. Sales of harnesses and leads increase 40% as families get puppies. Collar sales are stable because existing dog owners already have them.
Summer (June-August): Cooling bandanas and lightweight leads spike. Heavy winter coats drop to near-zero. Overall revenue dips 15-20% from spring.
Autumn (September-November): The biggest quarter. Christmas gifting drives collar and accessory set sales up 180% in November alone. This is when stockouts are most costly — a missed sale on a £25 collar set that was being bought as a gift is a permanently lost sale, not a deferred one.
Winter (December-February): Winter coat sales peak in December and January. January overall is their lowest month — post-Christmas spending hangover plus cold weather reducing dog walks and related purchases.
Their weeks cover targets reflect this: 6 weeks in summer, 8 weeks as the baseline, 14 weeks through autumn/Christmas, and 5 weeks in January. Every target is calculated per category, not as a blanket store-wide number, because different product categories have different seasonal curves.
Seasonal forecasting that adjusts automatically
Canopy gives Shopify brands the inventory clarity they need to grow.
The lead time trap: when to order seasonal stock
Here is where seasonal planning becomes genuinely difficult for brands with long supply chains. If your lead time is 190 days and you need extra stock for November, you have to place that order in early May — six months before the demand peak. In May, you are making purchasing decisions about Christmas based on projections, not certainty. There are two errors you can make: under-order (stockout during peak, lost sales forever) or over-order (excess stock sitting in your warehouse through January, tying up cash). The maths usually favours slight over-ordering. A stockout during Black Friday week costs you not just the lost sale but the ad spend you used to drive traffic that could not convert. Dead stock can eventually be cleared at a discount. But the ideal approach is to split your seasonal order into two tranches: a base order placed 190 days out covering 80% of your projected demand, and a top-up order via air freight (14-day lead time, 3x the cost per unit) for the remaining 20% once you have early-season sales data to validate your projections.
Summer lulls: how to avoid tying up cash
The opposite of peak season planning is equally important. During predictable low seasons, your weeks cover target should decrease to prevent cash being locked in slow-moving inventory. The risk during lulls is not stockouts — it is opportunity cost. Every pound tied up in excess summer inventory is a pound you cannot invest in stock for the autumn peak. Many brands order seasonally appropriate products in quantities based on peak-season run rates, then wonder why they have six months of summer bandanas in September when they need cash for Christmas stock. The fix: use your seasonal index to actively reduce order quantities during trough months, and set weeks cover alerts that warn you when stock levels exceed your seasonal target.
Tools for seasonal weeks cover management
Spreadsheets can handle seasonal index calculations, but they cannot update dynamically as actuals diverge from projections. This is where inventory management software earns its keep. The features that matter for seasonal planning: the ability to set different weeks cover targets by month or by date range, automatic seasonal index calculation from historical data, and alerts that adjust for seasonal context (a low weeks cover reading in January might be fine, while the same reading in October is an emergency). Canopy is being built with native seasonal adjustment. You set your baseline weeks cover target, connect your sales history, and the system calculates seasonal indexes per SKU category automatically. Reorder alerts adjust to the seasonal target, not the static baseline. And the lead time modelling tells you exactly when to place each seasonal order based on your supplier's actual delivery performance.
Frequently Asked Questions
Divide each month's average sales by your overall average monthly sales. If your average is £25,000/month and November averages £62,500, November's seasonal index is 2.5. Multiply your baseline weeks cover target by this index for your seasonal target.
Add your total lead time to your Black Friday date and work backwards. If your lead time is 190 days (China sourcing with sea freight), you need to place orders by mid-May. For shorter lead times (30-60 days), August-September ordering is typical.
No. Different product categories have different seasonal curves. Dog coats peak in winter while cooling accessories peak in summer. Set seasonal indexes per category, not per store.
Minimum 2 years for reliable seasonal indexes. With only 1 year, you cannot distinguish genuine seasonal patterns from one-off events. Three years gives you the most reliable baseline.
Use industry benchmarks for your first year. For general ecommerce, assume November is 2-3x average, January is 0.5-0.7x average, and summer is 0.7-0.9x average. Adjust based on your actual data as it accumulates.
Canopy calculates seasonal indexes automatically from your Shopify sales history and adjusts weeks cover targets per SKU category. Reorder alerts reflect the seasonal target, and lead time modelling tells you exactly when to place each seasonal order.
Related pages
Related Articles
Get early access to Canopy
The inventory system built for Shopify brands. No spam — just a heads-up when we launch.