Shopify Inventory Forecasting: How to Get Started with Demand Prediction
By Canopy Team
Quick answer
Inventory forecasting predicts how many units of each product you will sell in the coming weeks or months, so you can order the right amount of stock at the right time. Getting started requires three things: at least 90 days of sales history in Shopify, knowledge of your supplier lead times, and a method for calculating forward demand. You can start with a simple spreadsheet formula (average daily sales x lead time in days = reorder quantity) and graduate to AI-powered forecasting tools as your catalogue grows beyond 200-300 SKUs.
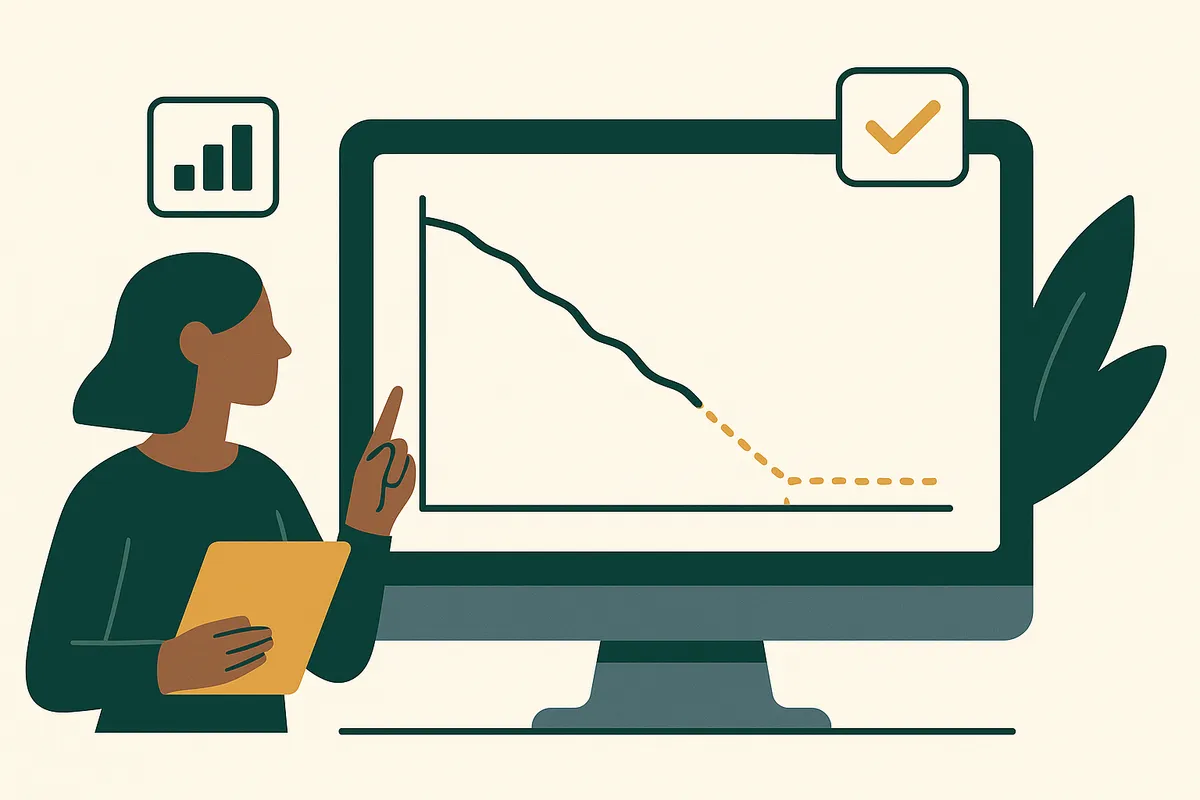
What demand forecasting means for Shopify brands
Demand forecasting sounds like enterprise jargon, but it is something every ecommerce founder does intuitively. When you look at your bestselling product and think "I should reorder before we run out," you are forecasting demand. The difference between intuitive forecasting and systematic forecasting is precision and consistency. Your gut feeling might correctly predict that you need more stock, but it cannot tell you whether you need 200 units or 400 units, or whether you should order now or wait three weeks. Systematic forecasting uses your actual sales data to answer these questions with numbers rather than intuition. It does not need to be perfect — even a basic forecast that is 70% accurate will outperform gut feeling on a catalogue of 200+ SKUs where you simply cannot hold detailed intuitions about every product.

Step 1: gather your historical sales data
The foundation of any forecast is historical data. Shopify stores this natively — you can export your order data from Settings > Analytics. For demand forecasting, you need at minimum 90 days of sales data. Ideally, 12 months gives you seasonal patterns and 24 months lets you verify that seasonal patterns are consistent. Export your data at the SKU level (not just product level) including the date of each sale and the quantity sold. If you sell "Navy Tartan Collar" in Small, Medium, and Large, you need sales data for each size separately because they sell at different rates. A common mistake is forecasting at the product level and then splitting the forecast across variants evenly. A Medium might sell 3x more than an XS — equal splitting guarantees you will stockout on Medium while sitting on excess XS.
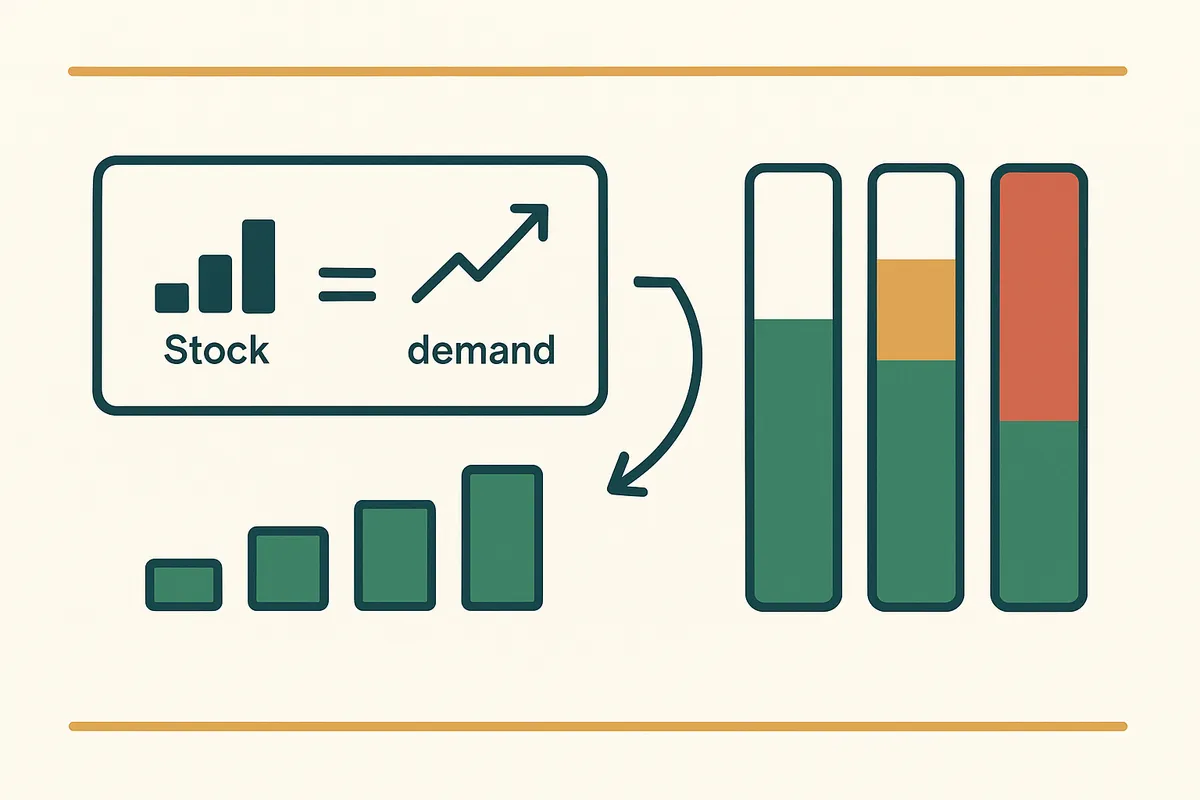
Step 2: calculate your baseline demand rate
The simplest demand calculation: take the total units sold of a SKU in the last 90 days and divide by 90 to get the average daily sales rate. Then multiply by 7 to get the weekly rate. For example, if you sold 180 units of "Navy Tartan Medium" in the last 90 days: 180 / 90 = 2 units per day, or 14 units per week.
This is your baseline demand rate. It tells you that at current velocity, you sell roughly 14 of these per week. If you have 112 units in stock, you have 112 / 14 = 8 weeks of cover.
The limitation of this method is that it assumes the future will look like the recent past. If you are approaching a seasonal peak, 90-day averages will understate demand. If you just finished a sale that inflated recent numbers, it will overstate demand. More sophisticated forecasting addresses these issues, but this baseline calculation is where everyone should start.
Step 3: identify trends in your data
Beyond the baseline average, look for three types of patterns in your sales data:
Growth or decline trends: Is the SKU selling more each month or less? A product selling 100 units in month 1, 120 in month 2, and 140 in month 3 has a clear upward trend. Forecasting based on the average (120/month) will underestimate future demand. You should project the trend forward: expect ~160 in month 4.
Seasonal patterns: Does demand spike or dip in certain months? This requires at least 12 months of data to identify. Compare the same month across years — if November is consistently 2x your average, that is a seasonal pattern you can plan for.
Promotional effects: Did past sales spikes correspond to promotions, marketing campaigns, or external events? If you ran a 25% off sale in February that doubled sales for that week, those inflated numbers will distort your baseline calculation unless you adjust for them. The easiest adjustment: remove promotional periods from your baseline calculation and treat promotional demand as a separate, planned uplift.
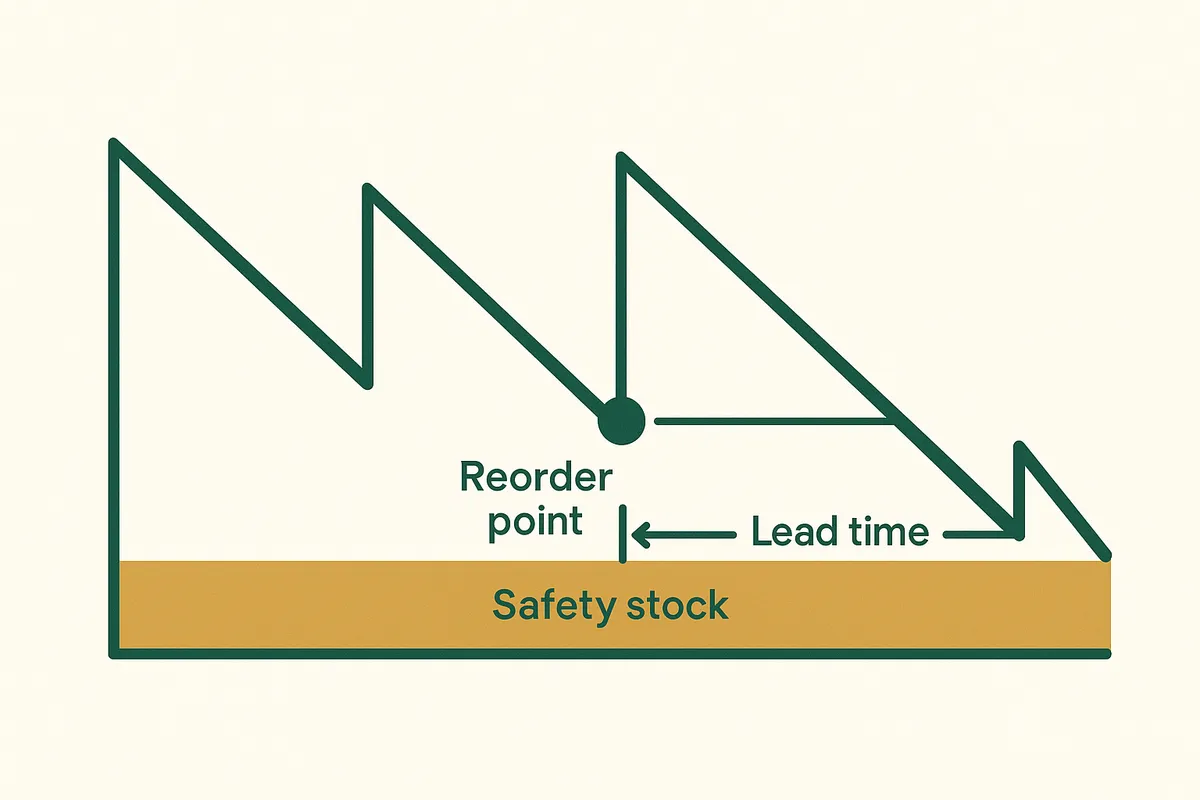
Step 4: factor in lead time
This is where many brands get forecasting fatally wrong. Your forecast is not just "how many will I sell?" — it is "how many will I sell between now and when my next order arrives?" If your lead time is 14 days (domestic UK supplier), you need to forecast 2 weeks of demand. If your lead time is 190 days (China sourcing with sea freight, like Bailey & Coco), you need to forecast more than 6 months of demand.
The formula: Reorder Quantity = (Average Daily Sales x Lead Time in Days) + Safety Stock - Current Stock on Hand.
For Bailey & Coco's "Navy Tartan Medium" selling 2 units per day with a 190-day lead time: (2 x 190) + safety stock = 380 + safety stock. If they want 4 weeks of safety stock (56 units), the reorder quantity is 436 units minus whatever they currently have on hand.
The longer your lead time, the more critical your forecast accuracy becomes. A 10% forecast error on a 14-day lead time means you are off by 1.4 days of stock. The same 10% error on a 190-day lead time means you are off by 19 days of stock — nearly 3 weeks.
How Bailey & Coco uses forecasting with 190-day lead times
Bailey & Coco's forecasting challenge is extreme: they need to predict demand 190 days into the future for 2,845 SKUs. At that horizon, no forecast is highly accurate — but even a moderately accurate forecast dramatically outperforms guesswork. Their approach combines three inputs:
First, the baseline: 90-day trailing average sales rate per SKU, adjusted for known seasonal patterns based on 3 years of historical data.
Second, the growth factor: their year-over-year growth rate applied to the baseline. If they grew 35% last year, the baseline is adjusted upward by a conservative 25% (they discount the growth rate to avoid over-ordering on an optimistic projection).
Third, the pipeline: stock already on order but not yet received. If they placed a PO 60 days ago that has not arrived yet, those units are coming and need to be subtracted from the reorder calculation.
This three-input model gives them a reorder suggestion for every SKU. It is not perfect — they estimate roughly 75% accuracy — but it prevents the catastrophic stockouts and overstock situations they experienced when ordering based on gut feeling. The 25% of SKUs where the forecast is wrong are typically either new products (no history to forecast from) or products affected by unpredictable viral social media exposure.
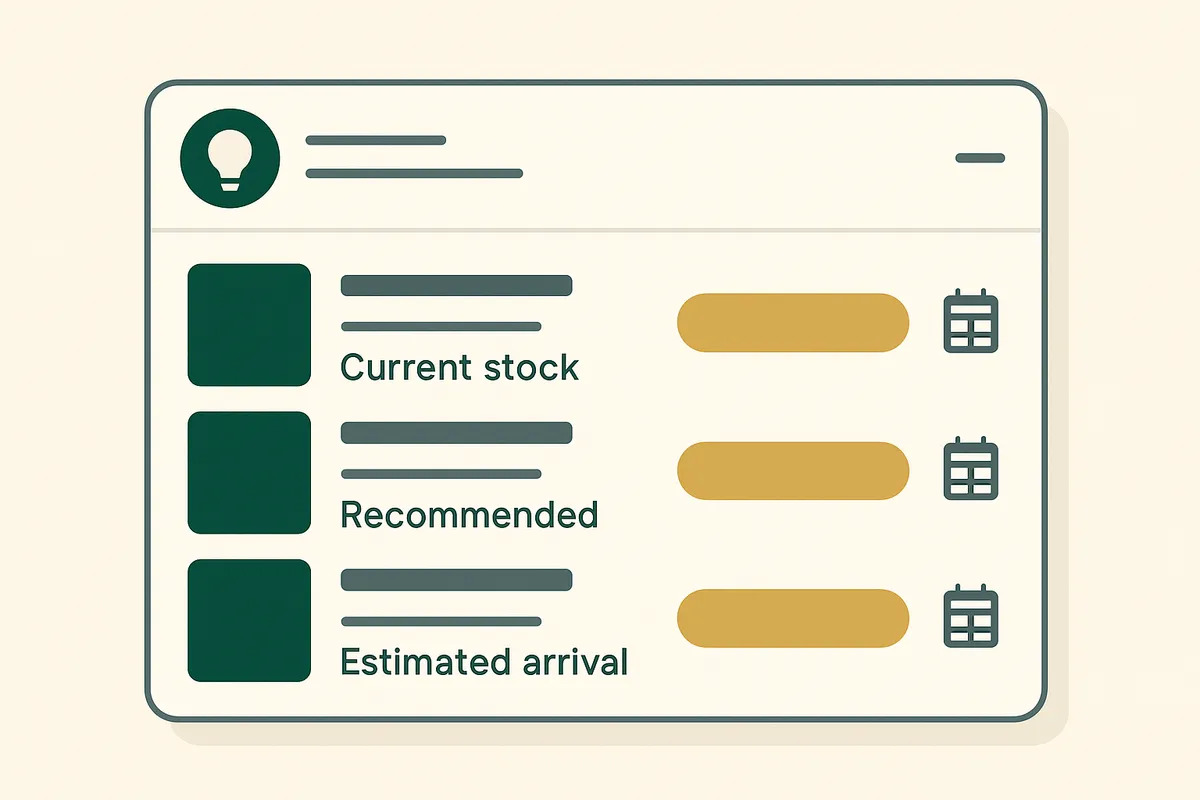
Demand forecasting that factors in your real lead times
Canopy gives Shopify brands the inventory clarity they need to grow.
AI-powered forecasting: when to upgrade from spreadsheets
Spreadsheet-based forecasting works well up to about 200-300 SKUs. Beyond that, the maintenance burden becomes unsustainable — you are spending hours updating formulas, adjusting for promotions, and manually checking results. AI-powered forecasting tools automate the process by continuously analysing your sales data, detecting seasonal patterns and trends, and generating reorder suggestions that update in real-time as new sales come in.
The key difference between basic and AI forecasting is not just automation — it is pattern detection that humans miss. An AI system might identify that a particular SKU's sales correlate with weather patterns, or that a product category experiences a sales dip every time a competitor runs a promotion. These patterns exist in the data but are invisible to manual analysis. When evaluating AI forecasting tools, look for: explainability (can you see why the system is suggesting a particular quantity?), override capability (can you adjust the forecast based on information the AI does not have, like a planned promotion?), and accuracy tracking (does the system show you how accurate its past forecasts were?).
Common forecasting mistakes to avoid
- Forecasting at product level instead of variant level — sizes and colours sell at different rates.
- Using annual averages instead of trailing 90-day data — you miss recent trend changes.
- Ignoring stockout periods — if you were out of stock for 3 weeks, those zero-sales weeks should not be included in your average.
- Forgetting to subtract pipeline stock — units already on order need to be accounted for.
- Applying the same forecast method to all SKUs — new products, seasonal items, and staples require different approaches.
- Not tracking forecast accuracy — if you never check how accurate your forecasts were, you cannot improve them.
Frequently Asked Questions
Minimum 90 days for basic demand rate calculations. 12 months to identify seasonal patterns. 24 months for reliable seasonal indexes. You can start with 90 days and improve accuracy as more data accumulates.
Average daily sales (units sold in last 90 days / 90) multiplied by your lead time in days, plus safety stock, minus current stock on hand. This gives you your reorder quantity.
Even 70% accuracy significantly outperforms gut feeling for catalogues over 200 SKUs. The goal is not perfection — it is to be consistently less wrong than manual ordering. Track your accuracy over time and aim for improvement.
Spreadsheets work well up to 200-300 SKUs. Beyond that, the maintenance burden of manual forecasting outweighs the cost of AI-powered tools. Switch to automated forecasting when updating your spreadsheets takes more than 2 hours per week.
Longer lead times require forecasting further into the future, which reduces accuracy. A 10% forecast error on a 14-day lead time is 1.4 days of stock. The same 10% error on a 190-day lead time is 19 days — nearly 3 weeks of potential stockout or overstock.
Yes. Canopy includes demand forecasting that uses your Shopify sales history, accounts for seasonal patterns, factors in your actual supplier lead times, and generates reorder suggestions with confidence levels. The forecasts update in real-time as new sales data comes in.
Related pages
Related Articles
Weeks Cover in Stock Management: Formula, Examples & How to Use It
Weeks cover tells you how many weeks your current stock will last at the current sales rate. Learn the formula, what good weeks cover looks like, and how to calculate it for thousands of SKUs.
Seasonal Weeks Cover Adjustments: How to Plan Inventory for Black Friday, Christmas & Summer
Learn how to adjust your weeks cover targets for seasonal peaks in ecommerce. Covers Black Friday, Christmas, summer lulls, and how to use Bailey & Coco's seasonal patterns to plan smarter.
Get early access to Canopy
The inventory system built for Shopify brands. No spam — just a heads-up when we launch.