Weeks Cover Explained: The Most Important Metric in Stock Management
By Andrew Simpson

Quick answer
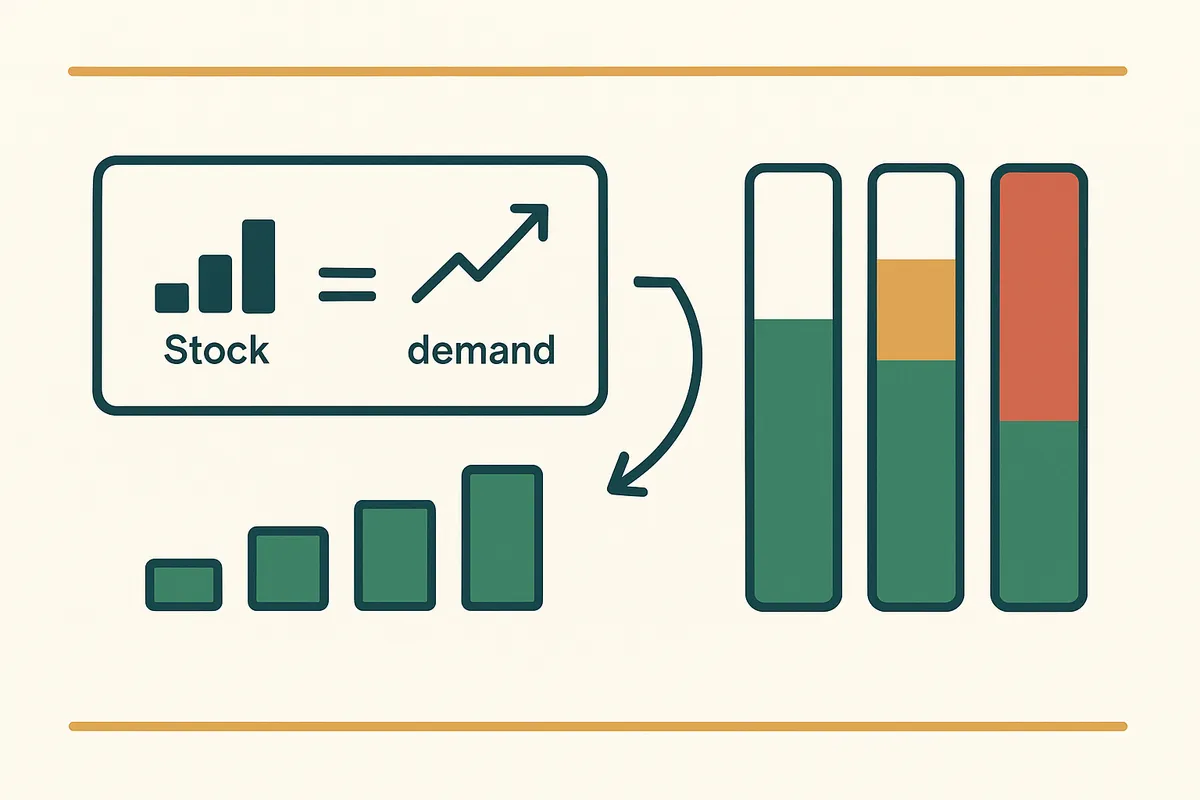
Weeks cover (also called weeks of stock or stock cover) is the number of weeks your current inventory will last based on your average weekly sales rate. The formula is: Weeks Cover = Current Stock / Average Weekly Sales. If you have 200 units and sell 25 per week, you have 8 weeks of cover. It's the single most useful metric for deciding when to reorder, what's overstocked, and where you're about to run out.
What weeks cover means in practical terms
Most inventory metrics are either backward-looking (what sold last month) or abstract (inventory turnover ratio). Weeks cover is forward-looking and immediately actionable. It answers the simplest question in stock management: "How long until I run out?"
The basic formula is straightforward:
Weeks Cover = Current Stock Quantity / Average Weekly Sales
But the devil is in the "average weekly sales" part. Which weeks do you average? If you sell Christmas baubles, your average weekly sales in July will give you a very different answer than your average in November. The period you use for the average directly affects the usefulness of the metric.
For most products, a rolling 8-week average works well. It's long enough to smooth out individual week fluctuations but short enough to reflect recent trends. For seasonal products, you need to use the equivalent period from the previous year — or a blended approach that weights recent weeks more heavily.
Why weeks cover matters more than other inventory metrics
Inventory turnover is the metric most commonly taught in business textbooks. It tells you how many times you sold through your average inventory in a period. The problem? It's a lagging indicator calculated over months or quarters. By the time your inventory turnover ratio tells you something useful, the damage is already done.
Weeks cover is an instant health check. You can look at it today and know immediately which SKUs are in danger and which are over-ordered. More importantly, you can act on it today.
Consider three SKUs in your catalogue: - SKU A: 12 weeks cover — comfortable, no action needed - SKU B: 3 weeks cover with a 6-week lead time — you needed to reorder 3 weeks ago - SKU C: 52 weeks cover — you have a year's worth of stock, tying up cash
That snapshot tells you more in 5 seconds than a quarterly inventory turnover report. SKU B is an emergency. SKU C is a cash trap. SKU A is fine. No spreadsheet pivoting, no ratio calculations, no comparing against industry benchmarks. Just raw weeks of supply.

Bailey & Coco: managing 2,845 SKUs with weeks cover
Bailey & Coco sells dog accessories with an enormous variant matrix: 152 patterns across collars, leads, harnesses, bow ties, and bandanas — each in 4-6 sizes. That's 2,845 active SKUs, each with its own sales velocity and stock level.
Before tracking weeks cover, their purchasing decisions were based on gut feel and whichever product the warehouse team noticed was running low. The founder would walk the shelves, spot a thin-looking shelf, and place an order. This approach has a name in inventory management: the "eyeball method." It works when you have 50 SKUs. It's catastrophic at 2,845.
Here's what went wrong. The "Teal Leopard" collar in size Medium was their #3 best-seller, averaging 38 units per week. But because it shared shelf space with the visually similar "Teal Safari" pattern, the warehouse team never noticed it running low. By the time they flagged it, they had 2 weeks of cover left — and their supplier lead time from China was 27 weeks (70-day production plus 120-day sea freight). They ran out of stock for 6 months.
Meanwhile, the "Blush Polka Dot" bandana in size Large — a seasonal summer line — had 74 weeks of cover. They'd ordered enough to last well into the following summer. That stock was tying up approximately £3,200 in cash that could have been used to purchase more Teal Leopard collars.
With a proper weeks cover dashboard, both of these problems are visible instantly. You sort by weeks cover ascending, and the SKUs about to stock out jump to the top. You sort descending, and the over-ordered SKUs are immediately obvious. No shelf-walking required.
See your weeks cover across every SKU
Canopy gives Shopify brands the inventory clarity they need to grow.
How to calculate weeks cover correctly
The basic calculation is simple, but getting accurate results across a large catalogue requires discipline on a few points:
- Use sell-through data, not revenue — weeks cover must be calculated in units, not pounds. A product selling £500/week might be 1 unit (furniture) or 200 units (stickers). The reorder urgency is completely different.
- Choose your averaging period deliberately — 4-week average for fast-moving consumables, 8-week average for general merchandise, 13-week (quarterly) average for slower-moving items. Don't use the same period for everything.
- Exclude stockout periods from your average — if a SKU was out of stock for 3 of the last 8 weeks, your average weekly sales is artificially depressed. The real demand was higher than what you sold. Exclude zero-sales weeks where inventory was also zero.
- Account for promotions and anomalies — a flash sale that sold 500 units in one week will skew your 8-week average dramatically. Either exclude promotional weeks or use a median instead of a mean.
- Calculate at the variant level, not the product level — "Navy Collar" is not one SKU. "Navy Collar Size M" and "Navy Collar Size XL" have entirely different sales velocities and stock levels. Always calculate weeks cover at the most granular variant level.
- Factor in lead time for the reorder decision — weeks cover tells you how long until you're out. Lead time tells you how long until new stock arrives. If you have 10 weeks cover and a 12-week lead time, you're already late.

What good weeks cover looks like
There is no universal "correct" weeks cover. It depends entirely on your supplier lead time, demand variability, and cash position. But here are useful benchmarks:
Domestic suppliers (1-2 week lead time): Target 4-8 weeks cover. Below 3 weeks is risky. Above 12 weeks is over-invested.
European suppliers (3-6 week lead time): Target 8-14 weeks cover. Below 6 weeks triggers a reorder. Above 20 weeks is over-invested.
China/Asia suppliers with sea freight (16-27 week lead time): Target 20-35 weeks cover. Below 18 weeks is critical. Above 52 weeks is a cash problem.
For Bailey & Coco, with their 27-week total lead time, the sweet spot is around 30 weeks cover. That gives them a 3-week buffer above lead time for demand spikes and shipping delays. Any SKU dropping below 27 weeks cover is flagged as urgent — they need to place a PO immediately or risk a stockout.
Tools that calculate weeks cover automatically
You can calculate weeks cover in a spreadsheet. Export your stock levels from Shopify, export your sales data, calculate the rolling average, and divide. The problem is doing this regularly. A spreadsheet calculation is a snapshot. The moment you export the data, it's already out of date.
For stores with under 100 SKUs, a weekly spreadsheet is manageable. Above that, you need a tool that calculates weeks cover continuously and alerts you when SKUs cross critical thresholds.
Canopy is being built with weeks cover as the foundational metric. Every SKU in your catalogue gets a live weeks cover figure that updates as sales come in and stock levels change. The dashboard sorts by urgency — SKUs below their reorder threshold are highlighted. Each SKU's reorder threshold is automatically set based on its specific supplier lead time, not a one-size-fits-all number. It's the approach Bailey & Coco needed when they were eyeballing shelves and hoping for the best.
Frequently Asked Questions
Weeks Cover = Current Stock Quantity / Average Weekly Sales. For example, 200 units in stock divided by 25 units sold per week equals 8 weeks of cover.
It depends on your supplier lead time. For domestic suppliers (1-2 week lead), target 4-8 weeks. For European suppliers (3-6 weeks lead), target 8-14 weeks. For China/sea freight (16-27 weeks lead), target 20-35 weeks cover.
Weeks cover is a forward-looking metric that tells you how long your current stock will last. Inventory turnover is a backward-looking ratio showing how many times you sold through stock over a past period. Weeks cover is more immediately actionable for reorder decisions.
Always at the variant level. A product might have healthy total stock, but individual variants (specific sizes or colours) could be critically low. Calculating at the product level masks these variant-level shortages.
For fast-moving products (daily sales), check weekly at minimum. For brands with long lead times (importing from Asia), daily monitoring is recommended because every day of delay in placing a reorder adds to the potential stockout window.
You will stock out. If your weeks cover is 10 weeks and your supplier lead time is 12 weeks, you are mathematically guaranteed to run out of stock before new inventory arrives, even if you place a purchase order immediately.
Related pages
Related Articles

Dead Stock in Ecommerce: How to Identify, Calculate Cost & Eliminate It
Dead stock costs the average Shopify merchant 20-30% of their inventory value. Learn how to identify dead stock, calculate the true carrying cost, and build clearance strategies that recover cash.

Shopify Inventory Management in 2026: What's Built In, What's Missing & What You Actually Need
Shopify's native inventory features have improved, but critical gaps remain. This guide covers what Shopify can and can't do for inventory management, the best apps to fill the gaps, and how to build a system that scales.

Stocky App Shutting Down: What Shopify Merchants Need to Do Before August 2026
Shopify's Stocky app is shutting down on 31 August 2026. Here's what happens to your purchase orders, demand forecasting, and stock reports — and the best Stocky replacements to migrate to.
Get early access to Canopy
The inventory system built for Shopify brands. No spam — just a heads-up when we launch.